



Busy does not mean utilised. A fleet can be fully booked and still be half empty.
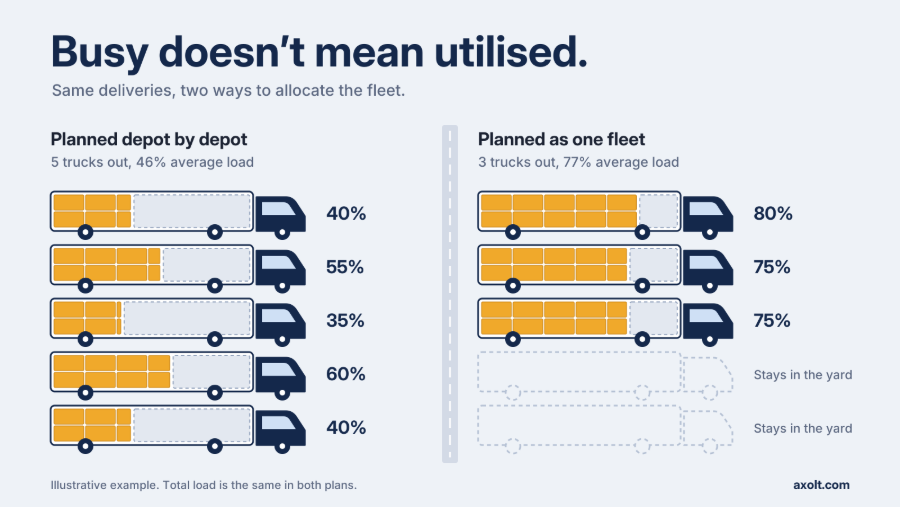
Same deliveries, two ways to allocate the fleet. Illustrative example.
Every truck leaves the depot. Every driver has a route. From the yard, the operation looks busy, organised and productive.
But ask a simple question and the picture changes: how much of that fleet’s capacity is actually being used? For many distributors, the honest answer is that nobody knows until the day is over, and by then the fuel is burned and the hours are paid.
This article is for operations directors, logistics managers and finance leaders at distributors and manufacturers who run their own delivery fleets. It explains why fleets that look fully stretched often carry far less than they could, why route optimisation alone rarely fixes it, and how to turn fleet utilisation from an end-of-day report into a decision you make before the first truck leaves.
What fleet utilisation really means
Fleet utilisation is the share of your available fleet capacity that is doing useful, paid-for work. It sounds simple, but most businesses measure only one part of it, and the part they measure is usually the most flattering.
The most common measure is vehicle utilisation: how many of your vehicles went out today. If 20 of 20 trucks left the depot, the fleet is reported as 100% utilised. That number tells you the fleet was busy. It does not tell you whether the fleet was useful.
A more honest picture combines three measures:
| Measure | The question it answers | Why it matters |
| Vehicle utilisation | How many vehicles were in use? | Shows activity, but rewards sending trucks out regardless of load |
| Load utilisation | How full was each vehicle, by weight, volume or pallet space? | Shows whether each trip carried enough to justify its cost |
| Time utilisation | How much of each driver’s shift was spent delivering? | Shows idle time, waiting time and uneven workloads |
Load utilisation is usually the one that hurts. It can be calculated simply as:
Load utilisation (%) = Load carried (weight, volume or pallets) ÷ Vehicle capacity × 100
Use whichever constraint fills first for your products. Heavy goods such as building materials hit their weight limit long before the vehicle looks full. Bulky, light goods such as insulation or packaging run out of space while weighing very little. Measuring the wrong constraint can make a truck look half empty when it is actually at its legal limit, or full when it could carry much more.
The point is not to chase a perfect number. It is to know, for every vehicle on the road, how much of its capacity you are paying for and how much you are using.
How sensible local decisions create a wasteful fleet
I have seen how easily distribution planning becomes fragmented. Each depot, region or customer team plans its own deliveries, assigns its own vehicles and makes sure its trucks are ready to go.
Individually, every one of those decisions makes sense:
- A regional planner keeps a vehicle on standby because a key customer sometimes calls with a same-day order.
- A branch manager sends a truck half full rather than make a customer wait until tomorrow.
- A sales team promises a delivery slot without seeing that another depot is already sending a vehicle to the same postcode that afternoon.
- A transport office books an extra vehicle on Monday because Monday has always been busy, whether or not this Monday is.
No one is doing anything wrong. Each person is protecting service levels with the information in front of them. The problem is that nobody is looking at the fleet as a whole.
Fragmentation tends to grow with success. A business that starts with one depot and one planner naturally plans everything together. Add a second site, an acquisition, a new region or a separate team for key accounts, and planning quietly splits along those lines. Each area gets its own spreadsheet, its own vehicles and its own habits. Within a few years, the business is running several small fleets that happen to share a logo.
The result is a fleet that is optimised locally and wasteful globally. Every depot can show you that its trucks were busy. Nobody can show you whether the business needed that many trucks on the road.
Seven signs your fleet is busy but under-utilised
Most businesses do not need a consultant to tell them whether this applies. The signs are usually visible on an ordinary weekday:
- Every vehicle goes out, every day. If your fleet count and your daily dispatch count are always the same, vehicles are probably being sent because they exist, not because the work needs them.
- Two trucks visit the same area on the same day. Different depots or teams serve neighbouring postcodes with separate vehicles, each carrying a partial load.
- Some drivers are finished by lunchtime while others are in overtime. Workload is decided by which area a driver belongs to, not by the total volume of work.
- Planning happens in spreadsheets that do not talk to each other. Each planner has a sheet that works for their area, and nobody has the combined picture.
- Load fill is unknown until the vehicle returns, if at all. You can report deliveries made, but not how full the truck was when it left.
- The answer to every peak is another vehicle. When things get tight, the instinct is to hire, lease or subcontract, rather than to ask whether the existing fleet is being used well.
- Customers are promised slots before capacity is checked. Sales commits to dates in isolation, and transport works backwards to make them happen, often with an extra trip.
If three or more of these sound familiar, the issue is unlikely to be a lack of trucks or drivers. It is more likely to be how the trucks you already have are allocated.
What it really costs
Add those local decisions together and a very different picture appears:
- Trucks running with empty space. Two vehicles cover the same area at half capacity when one could have done the job.
- Uneven workloads. Some drivers finish early while others run into overtime on overloaded routes.
- Vehicles sent because they were available, not because they were needed. An idle truck feels like waste, so it goes out anyway, and the fuel, wear and driver hours follow.
- Hidden capital cost. When the fleet looks stretched, the business leases or buys more vehicles, when the real issue is capacity already sitting unused.
- Avoidable emissions. Every unnecessary vehicle day adds to the fuel bill and to the carbon figures that customers and lenders increasingly ask about.
None of this shows up as a single dramatic failure. It shows up slowly, as a higher cost per delivery and margins that are thinner than they should be.
An illustrative example
Take one region served by two depots. Planned separately, they send out five vehicles a day at an average load of 46%. Planned together, the same deliveries fit on three vehicles at an average load of 77%. This is the scenario shown in the image at the top of this article.
Now put a cost on it. The figures below are illustrative assumptions, not benchmarks. Replace them with your own.
| Item | Planned depot by depot | Planned as one fleet |
| Vehicles dispatched per day | 5 | 3 |
| Average load | 46% | 77% |
| Assumed cost per vehicle day (driver, fuel, lease, insurance, maintenance) | £450 | £450 |
| Daily fleet cost | £2,250 | £1,350 |
| Annual fleet cost (250 operating days) | £562,500 | £337,500 |
In this example, the difference is £225,000 a year for one region, without a single extra delivery being made. Real life is rarely this tidy. Delivery windows, vehicle types and customer constraints will stop some loads combining. But even if better allocation removed just one vehicle a day, the same assumptions point to £112,500 a year.
That is why fleet utilisation deserves a place on the finance director’s agenda, not just the transport manager’s.
The problem starts before the route is built
When utilisation is poor, the first reaction is usually to look at routing. Can the drops be resequenced? Can the mileage come down? Should we buy route optimisation software?
Those are fair questions, but they often come too late. Delivery planning happens in a sequence, and each step can only work with what the step before it hands over:
- Demand. Which orders are due for delivery, to whom, and by when.
- Consolidation. Which of those orders can travel together, based on destination, delivery window, weight and volume.
- Allocation. How many vehicles the day needs, of which type, and which loads go on which vehicle.
- Routing. The best sequence of drops for each vehicle.
- Execution. Loading, dispatch, delivery and proof of delivery.
Route optimisation works on step four. By then, the biggest decision has already been made at steps two and three: how many vehicles go out, and what each one carries. If those decisions were taken depot by depot, a routing tool can only tidy up five half-empty routes. It cannot tell you that three would have been enough.
A perfectly sequenced route on a half-empty truck is still a half-empty truck.
The problem is not necessarily the routes. It is how the fleet was allocated before those routes were built. That is where the money is, and that is where most businesses have the least visibility.
Make utilisation a planning decision, not an end-of-day report
Fleet utilisation should not be a dashboard metric reviewed once the trucks are back. By then, it is history. It should be a decision made before they leave. In practice, that means changing five things.
1. Plan across the whole network
Start each planning cycle with every order due for delivery across all depots and regions, in one view, before any area claims its vehicles. This is the single biggest change, and often the hardest, because it asks local teams to give up some control. The reward is that consolidation opportunities become visible: the two deliveries to neighbouring towns, the depot with spare space on a route another depot is about to run.
2. Match orders to capacity before choosing vehicles
Group orders by destination, delivery window and the constraint that matters for your goods, whether that is weight, volume or pallet spaces. Only then decide how many vehicles the day needs. This reverses the usual habit of starting with the vehicles you have and filling them with what each area wants to send.
3. Allocate vehicles centrally
Assign vehicles based on load, route and vehicle type, not on which team owns them or which yard they sit in. Local teams still matter. They know the customers, the access restrictions and the awkward sites. But they should feed the plan, not each run a separate one.
4. Balance work across drivers
Spread drops and hours so that overtime is the exception, not the routine. A balanced plan protects drivers from burnout, reduces overtime costs and makes the operation more resilient when someone is off sick.
5. Close the loop: planned against actual
Compare how full each vehicle was planned to be with how full it really ran, and how long each route was expected to take against how long it did. The gaps show you where your assumptions are wrong: product dimensions that are out of date, sites that always take longer, customers who regularly change orders at the last minute. Feed that back into tomorrow’s plan.
The goal is not to squeeze every last box onto every truck. Some slack is healthy, and some customers will always justify a dedicated vehicle. The goal is to make sure every vehicle that leaves the depot has a clear reason to be on the road.
Where to start
You do not need to change everything at once. A sensible first step is to pick one region where two or more depots or teams overlap, and plan it centrally for four weeks. Measure vehicles dispatched, average load and overtime before and after. The numbers will tell you whether to go further, and they will give you the evidence to win over the teams who are understandably attached to running their own vehicles.
The data central planning depends on
Planning the fleet as one sounds like an organisational change, and partly it is. But it fails most often for a more practical reason: the planner does not have the information needed to do it. A central plan needs six things, and in most businesses they live in different places.
| What the planner needs | Why it matters | Where it often lives today |
| Confirmed orders and delivery dates | Defines the work to be done | CRM or order processing system |
| Stock availability by location | Shows which orders can actually ship, and from where | Warehouse or inventory system |
| Product weights, volumes and pallet counts | Turns orders into loads | Product master data, often incomplete |
| Customer delivery windows and site rules | Limits which orders can travel together | Account notes, emails, planners’ heads |
| Vehicle types and capacities | Defines what each truck can carry | Fleet spreadsheet |
| Shipment status and proof of delivery | Closes the loop between plan and reality | Carrier portals or driver paperwork |
Every handover between those systems adds delay and error. Orders are exported, stock is checked by phone, product dimensions are guessed, and the planner builds the day in a spreadsheet that is out of date before it is finished. Under that pressure, planning depot by depot is not a choice. It is the only way to get trucks out on time.
One item in that table deserves special attention: product data. Load planning is only as good as the weights and dimensions behind it. If half your product records have no volume, no system can tell you how full a truck will be. Cleaning up that data is unglamorous work, but it is often the first real step towards better utilisation.
You cannot plan a fleet you cannot see
Central fleet planning is, at heart, a visibility problem. When orders, stock, warehouse activity and shipments sit in separate systems, each area falls back on planning what it can see. That is how fragmentation starts, and why it survives even when everyone agrees it is costly.
The fix is not another spreadsheet or another integration between systems that were never designed to work together. It is a single, live record of the order from the moment it is confirmed to the moment it is delivered.
This is the problem Axolt was built to solve. Axolt runs sales orders, inventory, warehouse operations and shipping natively on Salesforce, on one data model. Planners see confirmed orders, available stock and outbound shipments in one place, across every location, so allocation decisions can be made for the business as a whole rather than one depot at a time.
In practice, that changes the planner’s day in four ways:
- One list of work. Every confirmed order due for delivery, across every location, is visible in one place, with the customer, the delivery date and the stock position alongside it.
- Stock you can trust. Planners see what is actually available at each warehouse before committing a load, so vehicles are not planned around goods that are not there.
- Warehouse and shipping in step. Picking, packing and shipment preparation work from the same orders the planner is looking at, so the warehouse is not loading to yesterday’s plan.
- Sales and transport on the same page. Because orders live on the same platform as your customer records, the people promising delivery dates and the people planning vehicles are looking at the same information.
Axolt is built for businesses that already run sales and customer service on Salesforce, or want to, and are tired of the gap between what the front office promises and what operations can deliver. Bringing those worlds together is what makes it possible to plan the fleet for the business as a whole.
For a closer look at how this works for distributors, see our pages on Salesforce inventory management and warehouse management.
The measures to track
If you change how the fleet is planned, you need to know whether it is working. These seven measures give a balanced view. Track them weekly, by region, and compare planned with actual wherever you can.
| Measure | What it tells you | Watch out for |
| Vehicles dispatched per day | Whether consolidation is reducing the number of trips | A fall that comes with late or failed deliveries |
| Average load utilisation | How full vehicles are, by your limiting constraint | Measuring volume when weight is the real limit, or the reverse |
| Cost per delivery | The combined effect of fewer trips and fuller loads | Cost allocation rules that hide fleet costs in overheads |
| Drops per route | How productive each vehicle day is | Rural routes that will always have fewer drops |
| Driver overtime hours | Whether workload is balanced | Overtime falling because work moved to subcontractors |
| On-time, in-full deliveries | Whether service is holding up as utilisation improves | Gains in utilisation bought at the cost of customer service |